Highlight governments or parties in control of the legislature by encircling the points.
Source:R/geom_highlight_government.R
geom_highlight_government.RdHighlight governments or parties in control of the legislature by encircling the points.
geom_highlight_government(expr, colour, size, shape, stroke)Source
https://yutani.rbind.io/post/2017-11-07-ggplot-add/
Arguments
- expr
Expr refers to the observation that you wish to highlight.
- colour
Colour of the highlight
- size
Size of highlighter
- shape
Shape of highlight
- stroke
Size of stroke shape
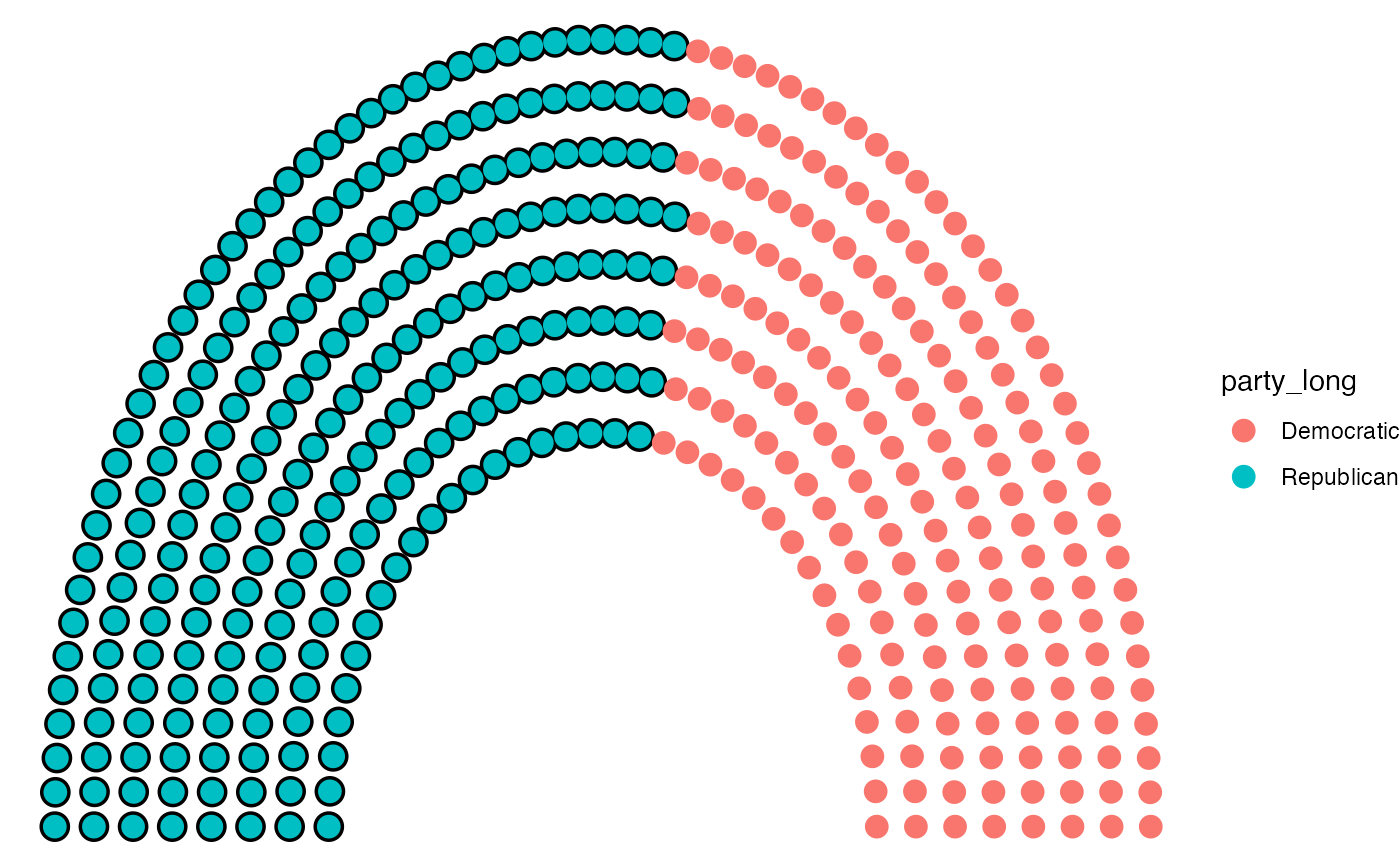
Examples
data <- election_data[
  election_data$country == "USA" &
    election_data$house == "Representatives" &
    election_data$year == "2016",
]
usa_data <- parliament_data(
  election_data = data,
  type = "semicircle",
  party_seats = data$seats,
  parl_rows = 8
)
ggplot2::ggplot(usa_data, ggplot2::aes(x, y, colour = party_long)) +
  geom_parliament_seats() +
  geom_highlight_government(government == 1) +
  theme_ggparliament()