Parliament seats The parliament seats geom is used for plotting data from parliament_data()
Source:R/geom_parliament_seats.R
geom_parliament_seats.RdParliament seats The parliament seats geom is used for plotting data from parliament_data()
geom_parliament_seats(mapping = NULL, data = NULL, stat = "identity",
  position = "identity", na.rm = FALSE, size = 3.5, show.legend = NA,
  inherit.aes = TRUE)
Arguments
- mapping
Mapping the aesthetics (the x and y coordinates, as well as the colour of each political party).
- data
The parliament_data data frame.
- stat
"identity"
- position
"identity"
- na.rm
If `FALSE`, the default, missing values are removed with a warning. If `TRUE`, missing values are silently removed.
- size
Size of the point
- show.legend
If `TRUE`, print legend. If `FALSE` do not print legend.
- inherit.aes
Inherit aes from other ggplot2 functions.
Examples
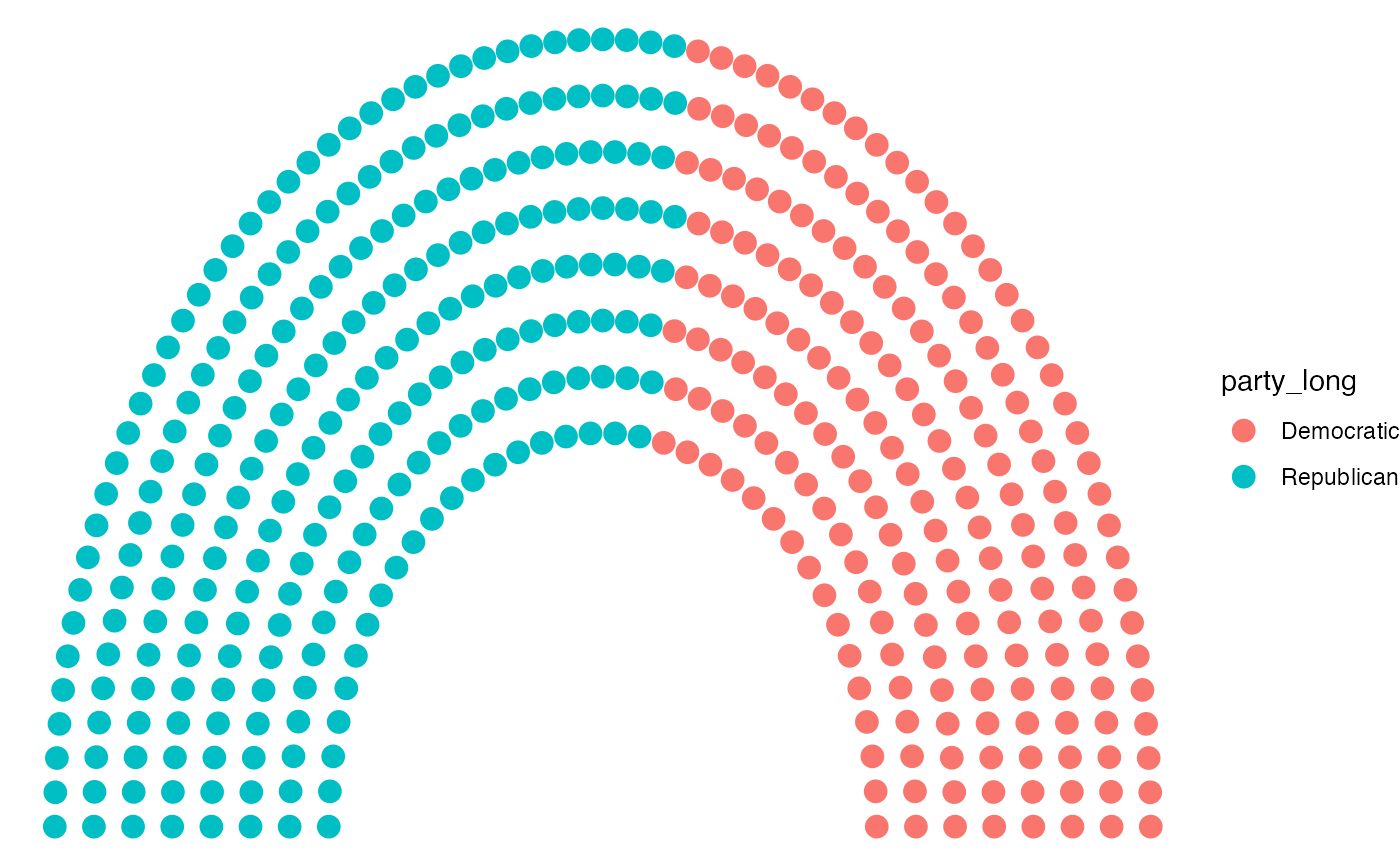
data <- election_data[
  election_data$country == "USA" &
    election_data$house == "Representatives" &
    election_data$year == "2016",
]
usa_data <- parliament_data(
  election_data = data,
  type = "semicircle", party_seats = data$seats,
  parl_rows = 8
)
ggplot2::ggplot(usa_data, ggplot2::aes(x = x, y = y, colour = party_long)) +
  geom_parliament_seats() +
  theme_ggparliament()