Emphasize certain parliamentarians (for example, female members of parliament) by increasing transparency on the remaining observations.
Source:R/geom_emphasize_parliamentarians.R
geom_emphasize_parliamentarians.RdEmphasize certain parliamentarians (for example, female members of parliament) by increasing transparency on the remaining observations.
geom_emphasize_parliamentarians(expr, size, shape, stroke)Arguments
- expr
The observation that you wish to emphasize
- size
The size of the point
- shape
The shape of the legislature seat (defaults to circle)
- stroke
The size of the stroke
Examples
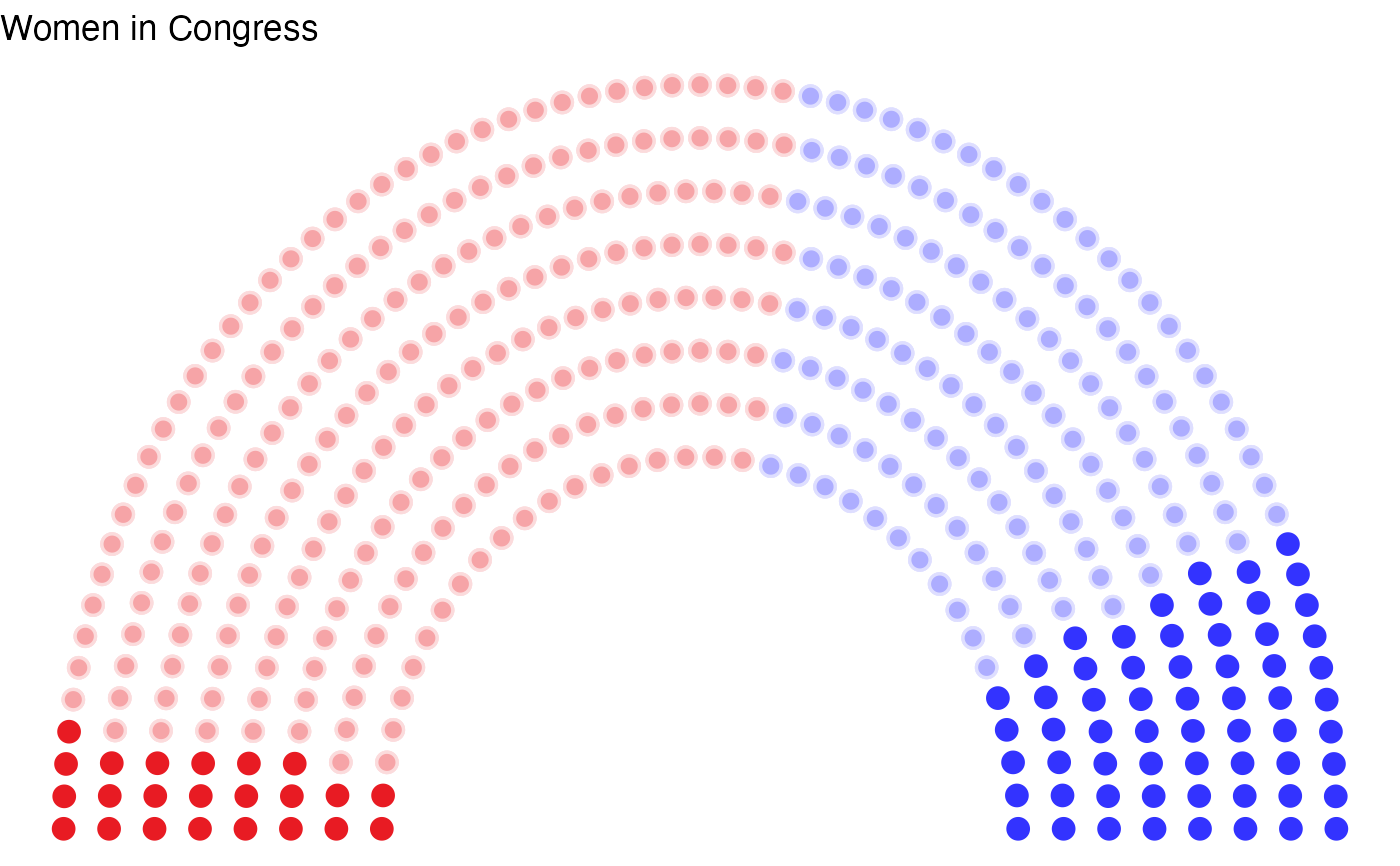
data <- election_data[
  election_data$country == "USA" &
    election_data$house == "Representatives" &
    election_data$year == "2016",
]
usa_data <- parliament_data(
  election_data = data,
  type = "semicircle",
  party_seats = data$seats,
  parl_rows = 8
)

women_in_congress <- c(1, 0, 0, 1)
number_of_women <- c(23, 218, 133, 61)

usa_data$women <- rep(women_in_congress, number_of_women)

ggplot2::ggplot(usa_data, ggplot2::aes(x, y, colour = party_long)) +
  geom_parliament_seats() +
  geom_emphasize_parliamentarians(women == 1) +
  theme_ggparliament(legend = FALSE) +
  ggplot2::scale_colour_manual(values = usa_data$colour, limits = usa_data$party_long) +
  ggplot2::labs(title = "Women in Congress")