Draw total number of seats in the middle of the parliament
Source:R/draw_totalseats.R
draw_totalseats.RdDraw total number of seats in the middle of the parliament
draw_totalseats(n = NULL, size = 12, colour = "black",
  type = c("horseshoe", "semicircle", "opposing_benches", "circle",
  "classroom"))
Arguments
- n
The number of total seats in the legislature.
- size
Size of font
- colour
colour of label
- type
Type of parliament (horseshoe, semicircle, circle, opposing benches, classroom)
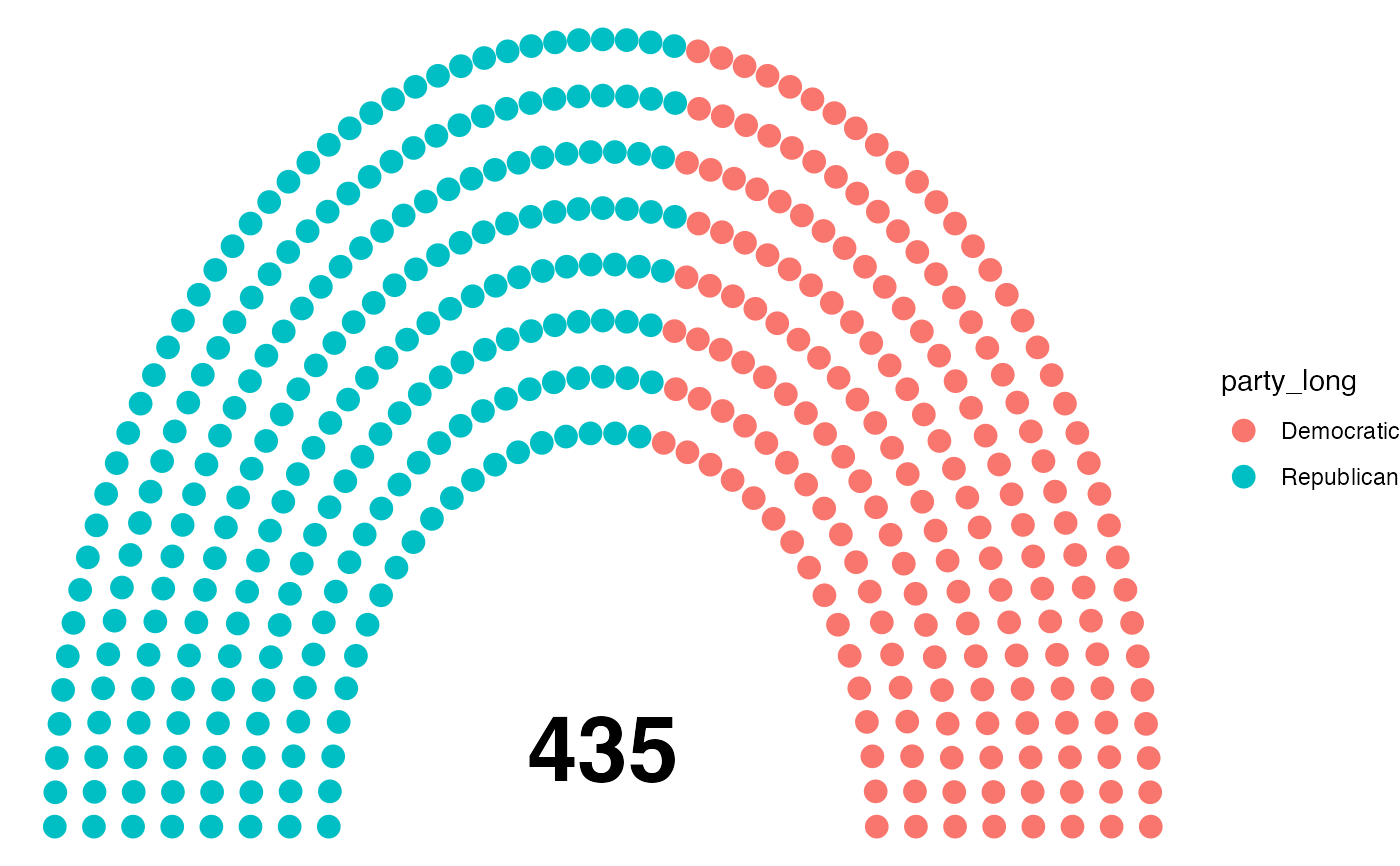
Examples
data <- election_data[
  election_data$country == "USA" &
    election_data$house == "Representatives" &
    election_data$year == "2016",
]
usa_data <- parliament_data(
  election_data = data,
  type = "semicircle",
  party_seats = data$seats,
  parl_rows = 8
)
ggplot2::ggplot(usa_data, ggplot2::aes(x, y, colour = party_long)) +
  geom_parliament_seats() +
  draw_totalseats(n = 435, type = "semicircle") +
  theme_ggparliament()