Draw labels for political parties and seats per party
Source:R/draw_partylabels.R
draw_partylabels.RdDraw labels for political parties and seats per party
draw_partylabels(type = c("semicircle", "horseshoe"), names = TRUE,
  seats = TRUE, party_names = party_names, party_colours = party_colours,
  party_seats = party_seats)
Arguments
- type
Define type. Currently only supports semicircle and horseshoe style parliaments.
- names
If TRUE, finds party names from data. Defaults to TRUE.
- seats
If TRUE, finds party seats from data. Defaults to TRUE.
- party_names
A column containing party names.
- party_colours
A column containing party colours.
- party_seats
A column containing party seats.
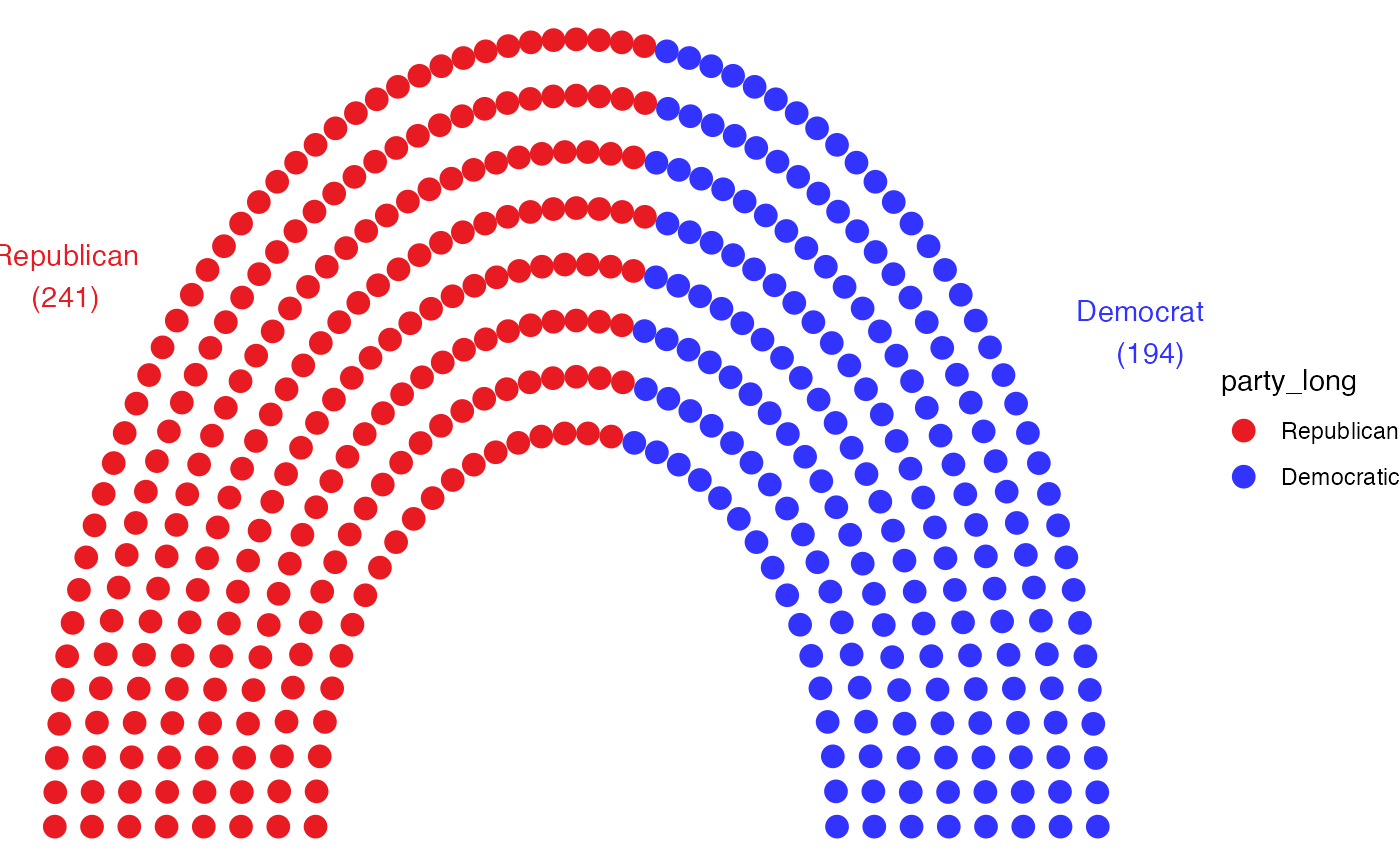
Examples
data <- election_data[
  election_data$country == "USA" &
    election_data$house == "Representatives" &
    election_data$year == "2016",
]
usa_data <- parliament_data(
  election_data = data,
  type = "semicircle",
  party_seats = data$seats,
  parl_rows = 8
)
ggplot2::ggplot(usa_data, ggplot2::aes(x, y, colour = party_long)) +
  geom_parliament_seats() +
  draw_partylabels(
    type = "semicircle",
    party_names = party_long,
    party_seats = seats,
    party_colours = colour
  ) +
  ggplot2::scale_colour_manual(
    values = usa_data$colour,
    limits = usa_data$party_long
  ) +
  theme_ggparliament()