Draw majority threshold
draw_majoritythreshold(n = NULL, label = TRUE, type = c("horseshoe",
  "semicircle", "opposing_benches"), linecolour = "black", linesize = 1,
  linetype = 2, linealpha = 1)
Arguments
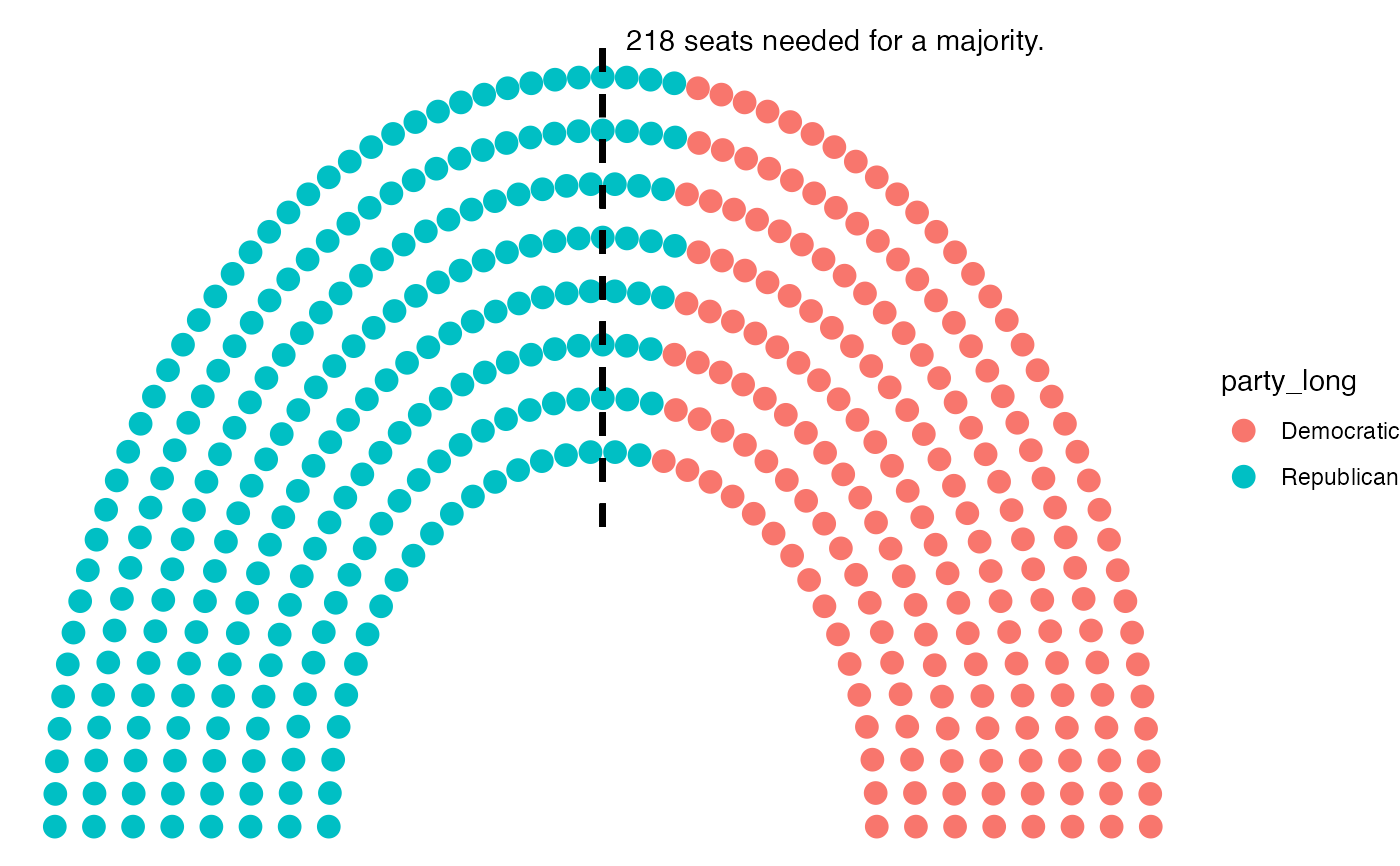
- n
The number of seats required for a majority
- label
A logical variable for labelling majority threshold. Defaults to TRUE.
- type
Type of parliament (horseshoe, semicircle,opposing benches)
- linecolour
The colour of the majority line. Defaults to gray.
- linesize
The size of the line. Defaults to 1.
- linetype
The style of the line. Defaults to 2, or a dashed line.
- linealpha
Set the transparency of the line. Defaults to 1.
Examples
data <- election_data[
  election_data$country == "USA" &
    election_data$house == "Representatives" &
    election_data$year == "2016",
]
usa_data <- parliament_data(
  election_data = data,
  type = "semicircle",
  party_seats = data$seats,
  parl_rows = 8
)
ggplot2::ggplot(usa_data, ggplot2::aes(x, y, colour = party_long)) +
  geom_parliament_seats() +
  draw_majoritythreshold(
    n = 218,
    label = TRUE,
    type = "semicircle"
  ) +
  theme_ggparliament()
#> Warning: All aesthetics have length 1, but the data has 435 rows.
#> ℹ Please consider using `annotate()` or provide this layer with data containing
#>   a single row.